Percent of Total Collection
In this case, the "total collection" is the total number of books in the continuous range of shelving from adult non-fiction 000 to adult non-fiction 999. It does not include any non-fiction items in special collections like ESL, Job Search, Travel, etc. that are in physically different areas of the building. This is a pretty basic spreadsheet (just getting warmed up!) The totals are just auto-sum formulas to make sure the total collection size adds up and the percentages equal 100%.

Percent of Total Circulation
Just as you need to know how many items are in each range of the total collection, you need to know how much of the total circulation is from each range.

Percent Change
This one shows how much the percentage of circulation changed from 2009 to 2010 for each range of the collection.

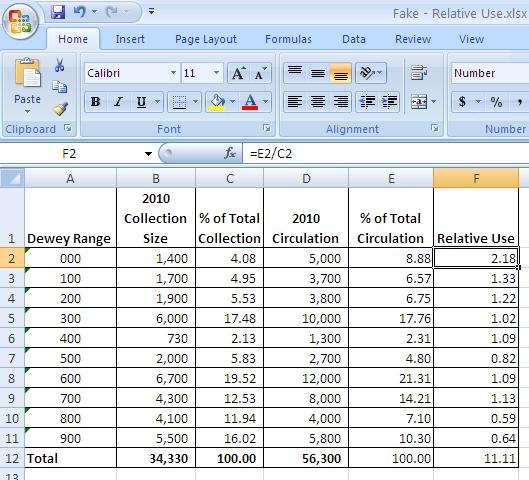
Ok, now let's talk about Relative Use. Relative use shows how much one piece of a collection is used compared to the whole collection. It is the percentage of circulation of that piece out of the whole, divided by that piece's percentage of the total collection. Here's the spreadsheet with the formula circled:
Relative Use 2009
(It doesn't fit on the page nicely with both years side-by-side)

Relative Use 2010
Current Shelf Allocation
One more piece: how many shelves does each range currently take up? I don't have these numbers for 2009, but it would be nice to compare which collections have shrunk and which have grown in a year's time.

The Next Step
I could, if I had time, add average size of item for each range. I could measure the height and width of a sample of books to come up with an average, and then factor that in. I'm going to consider collection size more qualitatively. I know which collections tend to have bigger items and which have smaller. Every collection has a few oversized items, but the average size can be factored in without actually measuring the items.
The next step will be to take all of this data and combine it. That will be complicated, and I haven't quite wrapped my head around that part yet. All of it points to shifting collections into a different number of shelves, which will be the last step.
Oops, the 2009 circulation for the 600s should be 17,000, not 1,700. Even with fake numbers, I wasn't going for a 605.8% change in circulation from one year to the next! I wanted more realistic numbers. Even so, you get the idea.
ReplyDelete